Fig. 3.


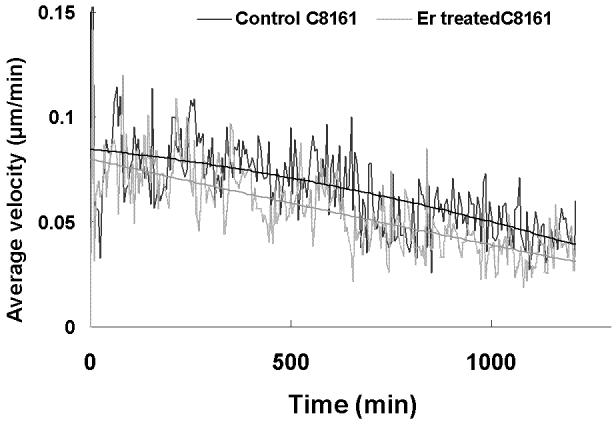
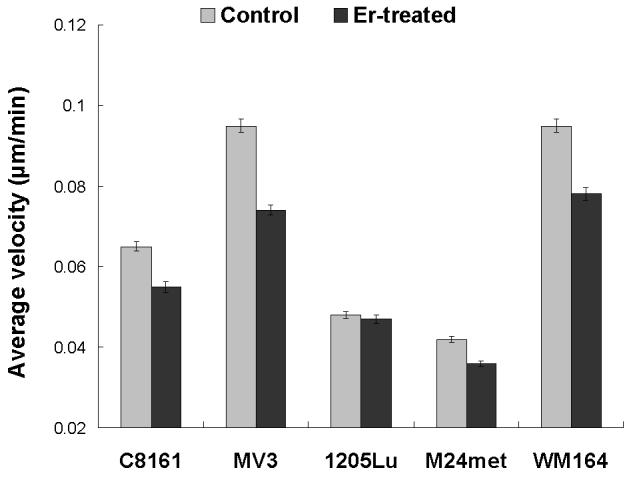
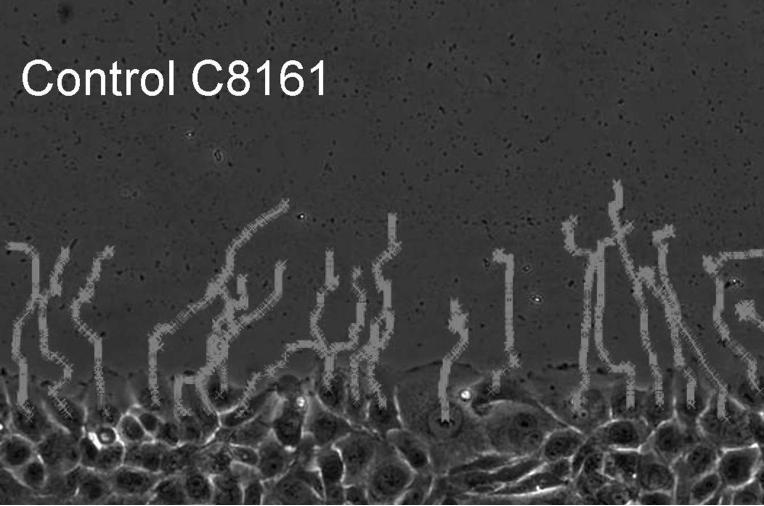
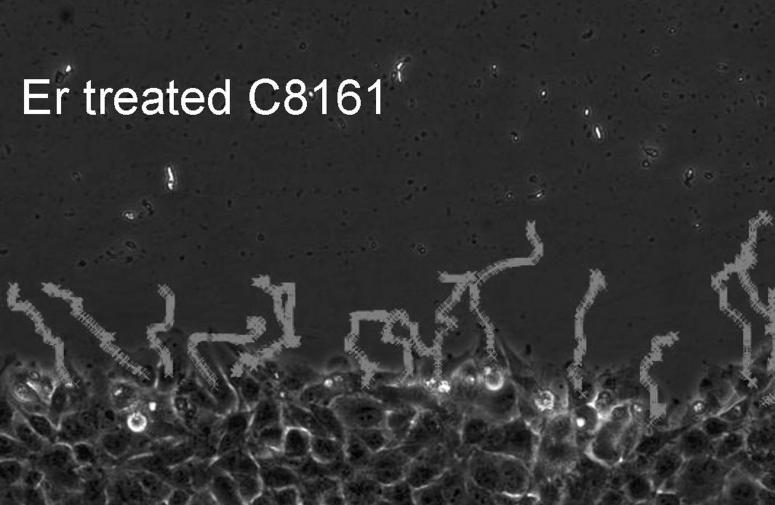
Time-lapse microscopy. Cells were wounded on fibronectin-coated plates. A, B: curved lines show the migration paths of C8161 cells at the leading edge; untreated (A) and treated with 3 μM eristostatin (B). C: Same cells as in A/B, plotted as average velocities over time with 3rd-order curves of best fit. Dark line = control; gray line = eristostatin-treated. D: Average velocities of all cell lines. Data are averaged from about 40 cells per experiment. Bars indicate standard error; * p < 0.05 vs. control.


