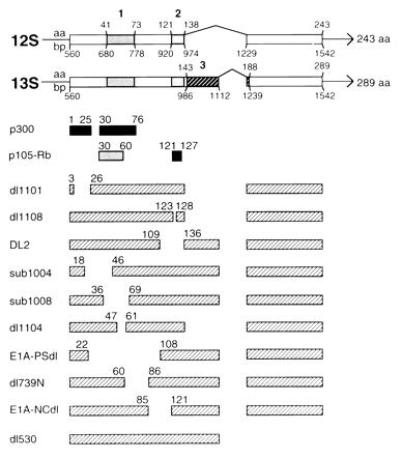
Figure 1.

Genetic map locations of mutations spanning the E1A first exon and E1A–cell protein binding sites. The top two bar diagrams represent sequences (exons) from which E1A 12S and 13S mRNAs are transcribed; interruptions (indicated by carets) represent introns. E1A CR1, CR2, and CR3 are indicated by the boldface numbers above shaded areas. Amino acid and base pair positions of conserved regions, and initiation, splice, and termination sites are shown. The next two sets of bars beneath the E1A transcription map indicate consensus sites for E1A binding with cellular p300 and p105-retinoblastoma (Rb) proteins. The lighter of the two Rb-binding sites (amino acids 30–60) is of secondary importance (reviewed in ref. 1). Mutant E1A oncogene names are listed in the left column. Hatched bars next to these names represent coding regions of mutant polypeptides. Numbers above these bars indicate the last amino acid expressed at the ends of deletions.
