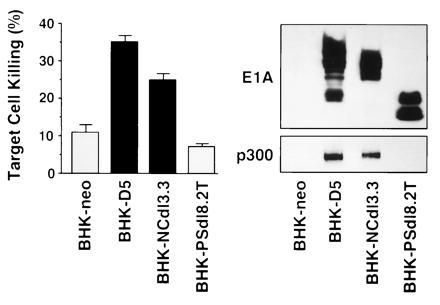
Figure 4.

Susceptibility to NK killing (Left), E1A expression (Upper Right), and E1A–p300 complex formation (Lower Right) in transfected BHK-21 cells. Bars represent the results (mean ± SEM) of eight NK cell assays. BHK-D5 and BHK-NCdl3.3 cells were significantly more susceptible to NK killing than the control transfectant, BHK-neo (P < 0.05). E1A oncoprotein expression was detected by quantitative Western blotting. E1A–p300 complexes were detected by the stepwise procedure described in the Fig. 2 legend.
