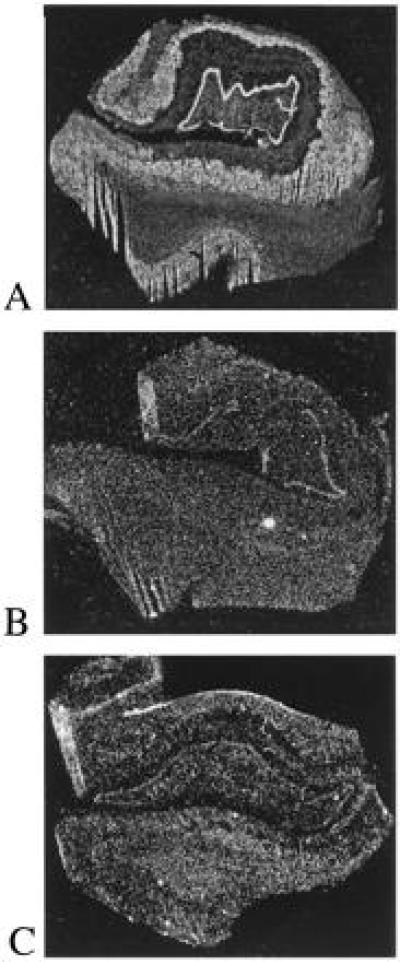
Figure 4.

Dark field autoradiograms demonstrating the expression of APP(695) and PS-1 mRNA (A) in human temporal lobe. This figure, and Figs. 2 and 4, were prepared using molecular analyst (Bio-Rad) and adobe photoshop image handling applications. (A) APP(695) mRNA expression in a neuropathologically normal case; (B) PS-1 mRNA expression in the same case as A; (C) expression of PS-1 mRNA in an 88-year-old female AD patient. There were no major differences in the pattern of expression of PS-1 mRNA between control and AD cases. Comparison between the level of expression of APP(695) and PS-1 in the control case reflects the relative abundance of the two mRNAs in human brain.
