
Fig. 8. The effect of cisplatin on PKC-α, PKC-δ, and PKC-ε in RPTC.
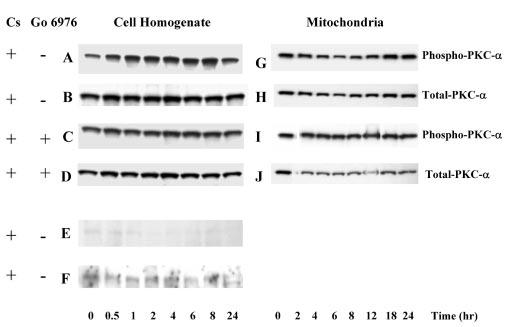
RPTC were treated with 50 μm cisplatin and samples were taken at 0, 0.5, 1, 2, 4, 6, 8, 12, 18, and 24 h for measurements of protein levels of phosphorylated (active) and total PKC-α, PKC-δ, and PKC-ε using immunoblotting. Samples were processed as described under “Experimental Procedures” and proteins separated using 10% SDSPAGE. Following electroblotting of the proteins to a nitrocellulose membrane, blots were blocked for 1 h in Tris-buffered saline containing 0.5% casein and 0.1% Tween 20, and incubated overnight at 4 °C in the presence of anti-phospho-PKC-α, anti-phospho-PKC-δ, anti-phospho-PKC-ε antibodies, or anti-PKC-α antibody diluted in the blocking buffer. Following washing, the membranes were incubated for 1 h with anti-rabbit or anti-mouse IgG coupled to horseradish peroxidase and washed again. The supersignal chemiluminescent system was used for protein detection and scanning densitometry for quantification of results. A–F, protein levels of phospho-PKC-α, phospho-PKC-δ, and phospho-PKC-ε in RPTC homogenates. G–J, protein levels of phospho-PKC-α in RPTC mitochondria. Go6976 (10 nm) was added 1 h prior to cisplatin exposure. Presented data are representative of three independent experiments (cell isolations).