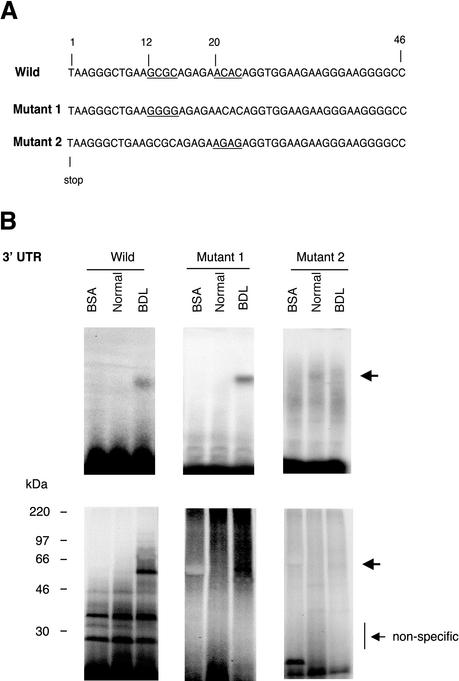
Figure 4.
Identification of a specific binding region within the proximal 46-base pair ECE-1 UTR. (A) Wild-type 3′ UTR (46-base pair fragment) is shown at the top. The underlined areas were mutated (12–15 and 21–24 base pairs). Mutant 1 (Mut 1) was of GCGC (12–15 base pairs) to GGGG and mutant 2 (Mut 2) was of ACAC (21–24 base pairs) to AGAG. (B) Cellular cytoplasmic extracts were incubated with 32P-labeled 46 base pairs of wild-type, mutant 1, or mutant 2 of ECE-1 3′ UTR as described in MATERIALS AND METHODS. RNA–protein complexes were analyzed by gel mobility assay (top) and UV cross-linking (bottom). Arrows indicate RNA–protein complexes. Bovine serum albumin was used as a negative control. The figure is representative of three different experiments.

