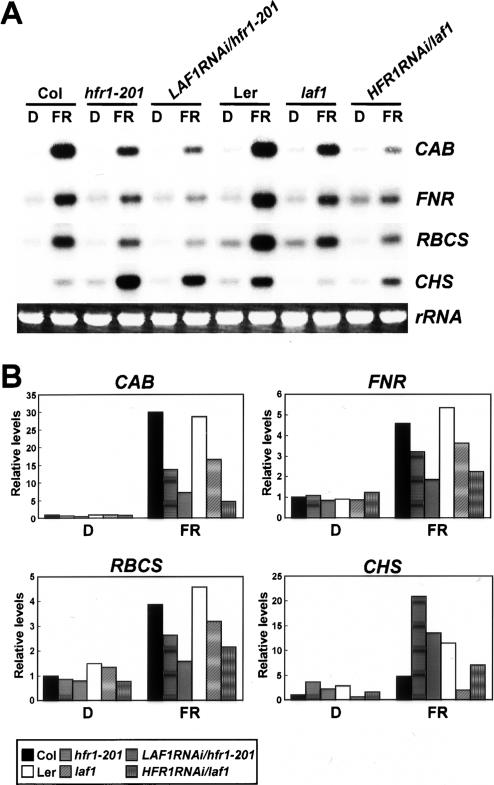
Figure 2.
FR-dependent expression levels of CAB, FNR, RBCS, and CHS in wild type and various mutants. The seedlings were grown in darkness for 4 d and then transferred to FR light (3 μmol m−2 sec−1) or kept in darkness for 18 h. Each lane contained 5 μg of total RNA. (A) Representative Northern blot analyses. CAB, FNR, RBCS, and CHS indicate RNA levels detected with the respective probes. Ethidium bromide-stained 28S rRNA was used as a loading control. (B) Quantitative expression levels of CAB, FNR, RBCS, and CHS in wild type (Col and Ler), hfr1-201, laf1, LAF1RNAi/hfr1-201, and HFR1RNAi/laf1. Expression levels of each gene and rRNA shown in A were quantified using the program Image Gauge version 3.12 (Fuji) of a PhosphorImage analyzer and normalized to D in the Col sample.

