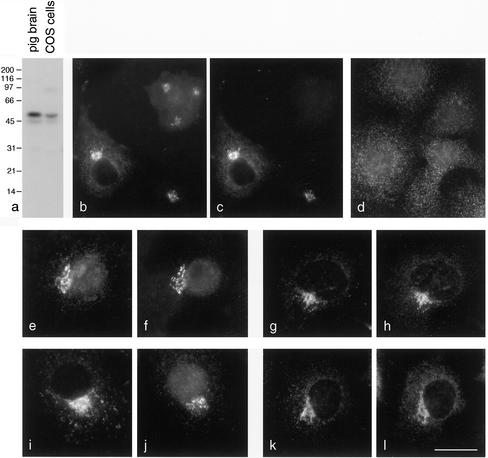
Figure 3.
Localization of p56. (a) Western blot showing that the anti-p56 antibody specifically labels a band of the expected size in both pig brain and COS cell homogenates. The lower molecular mass band may be a degradation product or a splice variant. (b and c) Double labeling of COS cells for endogenous plus tagged (b) and myc-tagged (c) p56. The two labeling patterns show complete colocalization in the transfected cells. (d) p56 is sensitive to BFA. COS cells were treated with BFA for 2 min and then labeled with the antibody against the endogenous protein. (e and f) Tagged GGA2 (e) and endogenous p56 (f) show good colocalization, although there is some background with the tagged GGA2. (g and h) Endogenous GGA1 (g) and tagged p56 (h) show excellent colocalization. (i–l) γ-Adaptin (i) and endogenous p56 (j), or γ-adaptin (k) and tagged p56 (l) have similar labeling patterns but do not colocalize as well as GGAs and p56. Bar, 25 μm (b–d); 20 μm (e–l).

