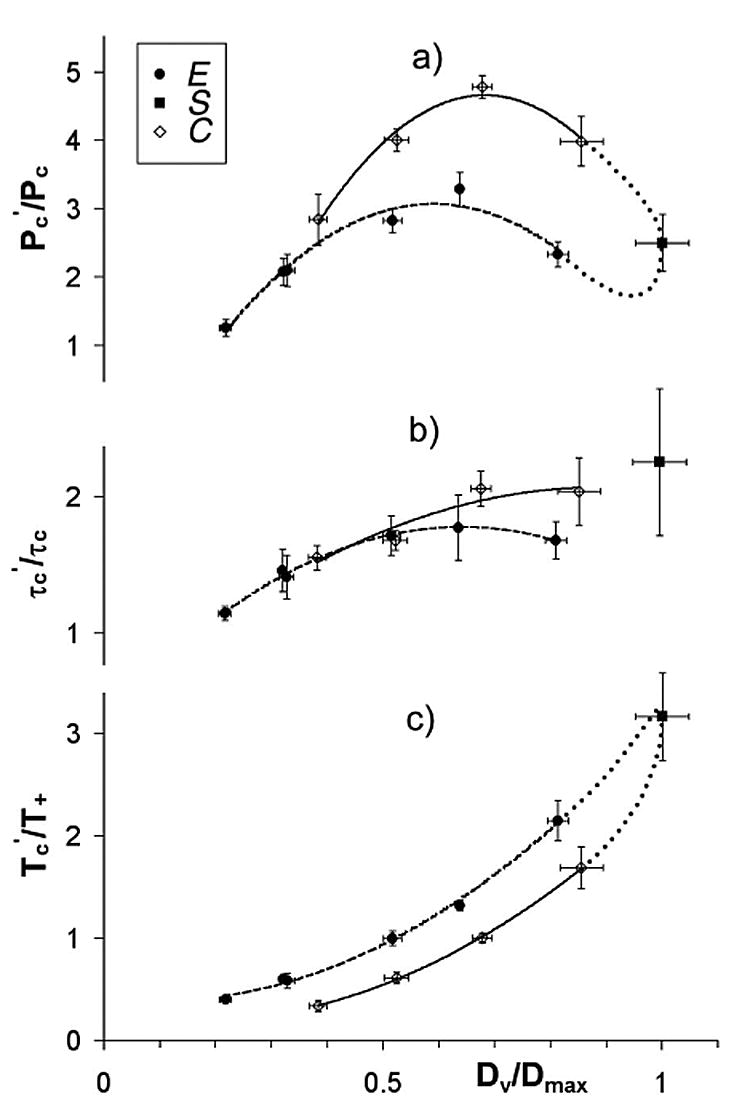
FIG. 5.

Normalized (a) peak pressure, (b) FWHM, and (c) collapse time versus normalized bubble diameter when lithotripter shock wave-bubble interaction occurs at the expanding (E), standing (S), and collapsing (C) phase of the bubble oscillation. Error bars show the standard deviation of the measurement data. Quadratic fits of the experimental data are shown in dashed lines (type E bubbles) and solid lines (type C bubbles). Dotted lines are hypothetical curves.
