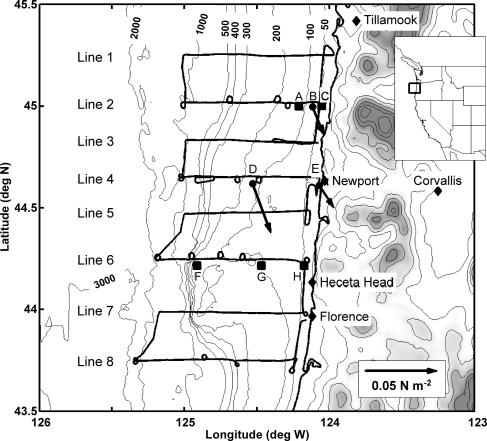
Fig. 4.
Map of the COAST study area during summer 2001 (3). A typical survey track of eight east–west lines is shown (the black line in a “radiator” pattern). Three oceanographic instrument moorings were located on Line 2 [from west to east: NSB (A), NMS (colocated with the COAST MB) (B), and NIS (C)], and three were located on Line 6 [from west to east: SSB (F), SMS (G), and SIS (H)]. The three surface meteorological sites are shown as solid dots: the COAST MB on Line 2 (B), NDBC buoy 46050 on Line 4 (D), and the NWPO3 C-MAN station at Newport (E). The mean wind stress for May through August, 2001, at each met site is shown. Ocean bathymetric contours are in meters. The height contour interval over land is 500 m.

