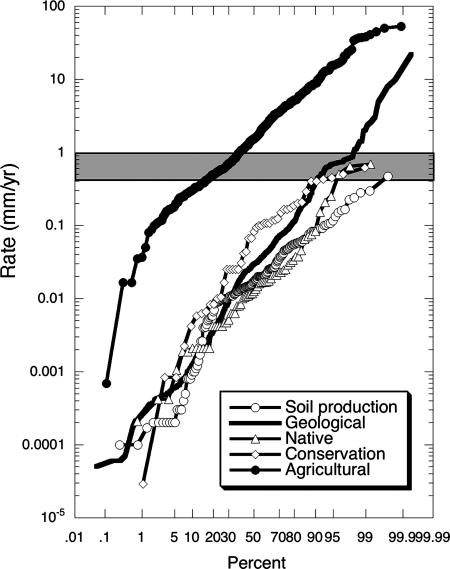
Fig. 2.
Probability plots of rates of soil erosion from agricultural fields under conventional (e.g., tillage) and conservation agriculture (e.g., terracing and no-till methods), with erosion rates from areas and plots under native vegetation, rates of soil production, and geologic rates of erosion (a composite distribution of the data for cratons, soil-mantled landscapes, and alpine areas in Fig. 1). Data sources for agricultural and geologic rates are the same as for Fig. 1. Shaded area represents range of USDA. T values (0.4–1.0 mm/yr) were used to define tolerable soil loss.

