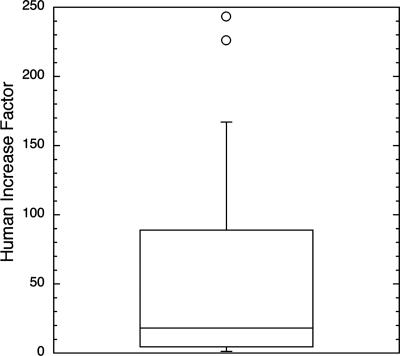
Fig. 3.
Box-and-whiskers plot showing the range of reported increases in erosion rate for studies reporting direct comparisons of erosion under conventional agriculture vs. native vegetation for comparable settings (n = 46, median = 18, mean = 124, minimum = 1.3, maximum = 1,878). Data include studies that reported both rates individually and those that simply reported a ratio between erosion rates under native vegetation and conventional cultivation.

