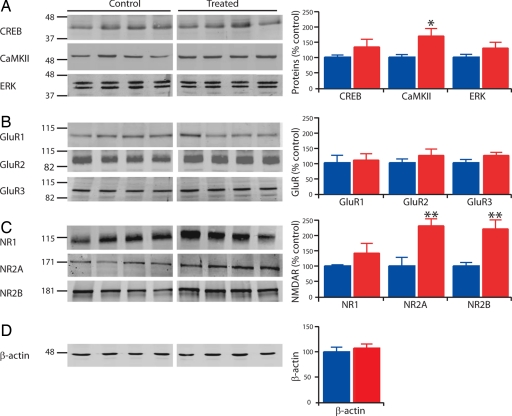
Fig. 1.
Enhanced CaMKII, NR2A, and NR2B protein expression levels. Examples of Western blots and mean values reported as percentage of control, normalized to in-lane control (β-actin). (A) Western blots of CREB (n = 6 and 7), CamKII (n = 11 and 11), and ERK (n = 12 and 12). (B) Western blots of AMPA receptor subunits GluR1 (n = 8 and 9), GluR2 (n = 8 and 8), and GluR3 (n = 8 and 8). (C) Western blots of NMDA receptor subunits NR1 (n = 8 and 8), NR2A (n = 8 and 8), and NR2B (n = 7 and 8). (D) Western blots of β-actin (n = 12 and 12). Data show mean ± SEM. *, P < 0.05; **, P < 0.01).

