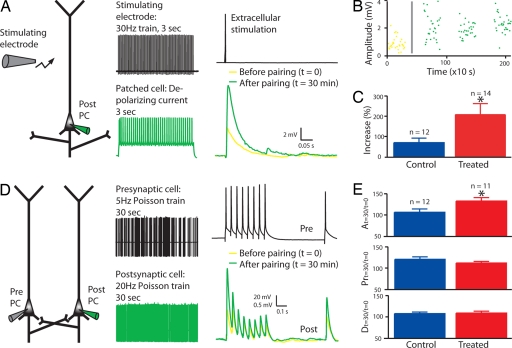
Fig. 3.
Enhanced postsynaptic plasticity. (A–C). LTP with extracellular stimulation in layer 2/3 pyramidal neurons. (A) Experimental scheme, pairing protocol, and example of mean response in a patched cell, before and after pairing. (B) Example of response amplitude as a function of time. The gray line represents the timing of the pairing protocol. (C) Mean of percentage increase in the amplitude of the response to extracellular stimulation after pairing. The absolute values of the response amplitudes are displayed in SI Fig. 6. (D and E) LTP in direct connections between layer 5 pyramidal neurons. (D) Experimental scheme, pairing protocol, and example of mean responses in the postsynaptic cell before and after pairing. (E) Mean of percentage change after pairing of the absolute synaptic efficacy A, the probability of release Pr, and the time constant for depression D. The absolute values of A, Pr, and D before and after pairing are displayed in SI Fig. 6. Data show mean ± SEM. *, P < 0.05.

