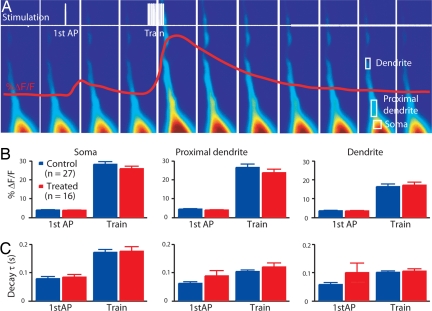
Fig. 4.
Unchanged calcium transient. (A) Scheme of stimulation protocol and example of fluorescence in a patched pyramidal neuron. (B) Percentage of change in the calcium signal in the first action potential and train stimulation at the three locations of analysis (at the soma, at the proximal apical dendrite, and on the dendrite, 50 μm away from the soma). (C) Decay time constant of the calcium signal at the corresponding locations. Data show mean ± SEM.

