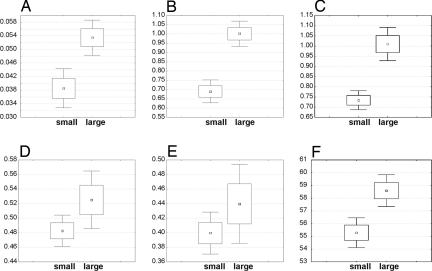
Fig. 1.
Comparison of averages of six molecular traits for 55 small (ln W < 9.04) and 55 large (ln W > 9.04) mammals where 9.04 is the median of loge transformed body mass W (in grams). (A) Ka/Ks, P < 0.001. (B) Polarity-based Kr/Kc, P < 0.001. (C) Volume-based Kr/Kc, P < 0.001. (D) Polarity–volume-based Kr/Kc, P = 0.069. (E) Charge-based Kr/Kc, P = 0.20. (F) Grantham distance, P < 0.001 (t test). Small squares represent mean; rectangles are ±1 SE; and whiskers are 0.95 confidence interval.

