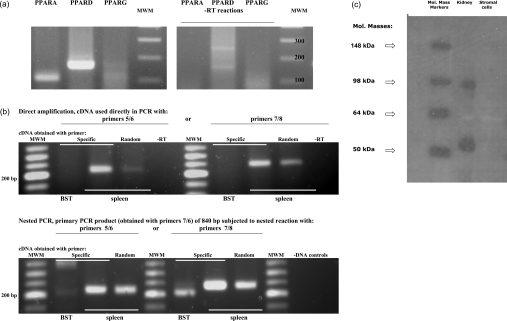
Figure 3. Identification of PPARs.
Total RNA extracted from stromal cells or bovine spleen (positive control) was analysed by PCR. (a) Initial analysis for PPAR isoforms in stromal cells. PPARα (PPARA) and PPARδ (PPARD) were expressed, but not PPARγ (PPARG). The expected products of 105 bp and 159 bp for PPARα and PPARδ, obtained using the PPARα and PPARδ primers described in the Materials and methods section, were verified by sequencing. No product was obtained for PPARγ using primers PPARγ5 and PPARγ2. Right-hand panel represents control reactions without reverse transcriptase. (b) Further analysis for PPARγ. Total RNA from stromal cells (BST) and spleen was reverse-transcribed using the specific primer PPARγ6 (Specific) or random hexamers (Random), and subsequently used in direct amplification (upper panel) or in nested PCR (lower panel) with primers PPARγ5/PPARγ6 (5/6) or PPARγ7/PPARγ8 (7/8). In direct amplification, spleen gave products of the expected sizes, which were verified by sequencing, but no product was obtained with stromal cells. To confirm the lack of amplification in stromal cells, a nested approach was subsequently used. The first round of nested PCR (lower panel) using primers PPARγ7/PPARγ6 (7/6) generated a product of 840 bp, which was then used as a template with primers PPARγ5/PPARγ6 (5/6) or PPARγ7/PPARγ8 (7/8). RNA from spleen generated a positive reaction, but stromal cells failed to generate a product of the appropriate size. MWM, molecular-mass markers; -RT, controls without reverse transcriptase; -DNA, controls without cDNA with primer pairs PPARγ5/PPARγ6 and PPARγ7/PPARγ8. (c) Immunoblotting for PPARγ. Lane 1, molecular-mass markers (in kDa); lane 2, control extract of ovine kidney tissue; lane 3, untreated stromal cells.

