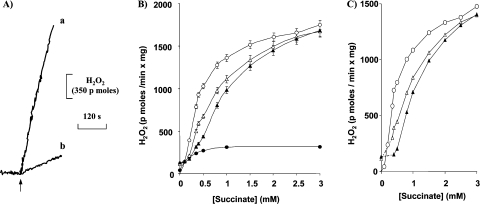
Figure 1. Titration of succinate-promoted H2O2 generation.
(A) Different rates of H2O2 production are elicited by GM and succinate. Succinate (trace a) and GM (trace b) were 1 mM. Mitochondria (0.75 mg/1.6 ml) were incubated in standard incubation medium containing HRP. Amplex Red was added at the time indicated by the arrow. (B) H2O2 production was measured in the absence (○) and presence of GM, 1 mM (Δ) or 2 mM (▲) each. Where present, rotenone was 2.5 μM (●) without GM. (C) Net H2O2 releases calculated by subtracting the rotenone rates from the rates in the absence of rotenone in (B). Traces in (A) are representative of duplicate traces from at least seven independent experiments. Results in (B) are means±S.D. for at least five independent experiments.

