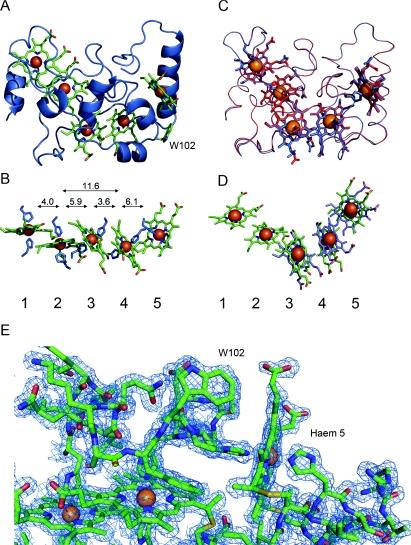
Figure 1. Crystal structures of NrfB.
All Figures showing protein structures were prepared using PyMOL (DeLano Scientific). (A) The crystal structure of E. coli NrfB represented as the α-carbon trace with five haems and Trp102 displayed in green. (B) Haem organization within NrfB, histidine side chains are shown in blue. The distances (in Å) between haems are shown above; the haem numbers are shown underneath. (C) Superimposition of the oxidized and reduced haem structures. The α-carbon trace and haems of the oxidized and reduced enzymes are shown in red and blue respectively. (D) Superimposition of haems 1, 2 and 3 (blue) over haems 3, 4 and 5 (green) with an rmsd of 1.9 Å. The haem numbering refers to the green haems. (E) Region of the electron-density map contoured at 1.1 σ calculated from the final refined structure of oxidized NrfB in the region of haems 5, 4 and 3 and Trp102. The Figure demonstrates the quality of the fit of the structural model to the map.

