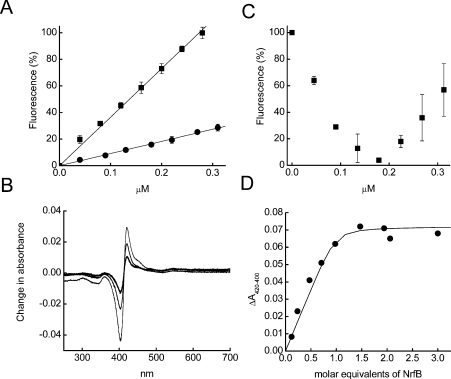
Figure 3. Complex formation between NrfA and NrfB measured by fluorescence and absorption spectroscopy.
(A) Dependence of the relative fluorescence of NrfB (■) or NrfA (●) on protein concentration. 100% represents the maximum fluorescence obtained with 0.31 μM NrfB. Results are means±S.D. for three separate experiments. (B) Titration of 0.18 μM NrfB with 0–0.31 μM NrfA. The percentage scale on the y-axis represents the change in fluorescence obtained, where 100% is the maximum observed in the experiment (0.18 μM NrfB in the absence of NrfA) and 0% is the minimum observed in the experiment (0.18 μM NrfB in the presence of 0.18 μM NrfA). Results are means±S.D. for three separate experiments. (C) Shift in the UV–visible spectrum following addition of 0.4 (—), 0.8 (—) or 2.4 (−)μM NrfB to a solution containing 1.7 μM NrfA. (D) The amplitude of the change in absorbance shown in (C) plotted as a function of NrfB concentration; the line was fitted iteratively using eqn (1) as described in the Experimental section.

