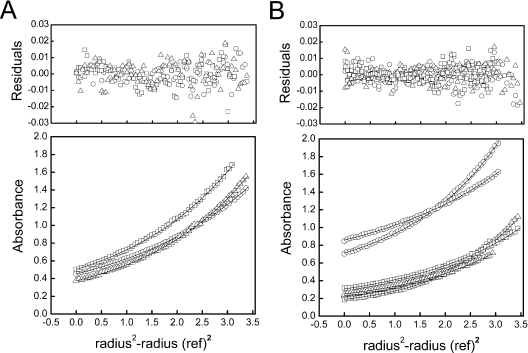
Figure 4. Sedimentation equilibrium analyses of NrfA and NrfB.
(A) Dissociation of the NrfA dimer in solution as monitored by sedimentation equilibrium. NrfA in 50 mM sodium Hepes (pH 7.0) and 2 mM CaCl2 was centrifuged at 9000 rev./min at 20 °C for 24 h until equilibrium had been achieved. Lower panel: the absorbance profiles of NrfA at 2 (○), 10 (□) and 20 (△) μM were all fitted to a model where the NrfA dimer dissociated into 53 kDa monomers with a KAAd of 4.0±0.7 μM. Upper panel: residual difference between the experimental data and the fitted curves. (B) Dissociation of the NrfA2–NrfB2 tetramer into NrfA–NrfB heterodimers. NrfA–NrfB at 1, 5 and 20 μM was centrifuged at 7500 or 9000 rev./min at 20 °C until equilibrium was achieved. Lower panel: absorbance profiles of the NrfA–NrfB complex at 1 (○), 5 (□) and 20 (△) μM at both 7500 and 9000 rev./min were fitted to a model where the NrfA2–NrfB2 tetramer dissociated into 74 kDa NrfA–NrfB heterodimers with a Kd of 4.1±0.2 μM. Upper panel: residual difference between the experimental data and the fitted curves.

