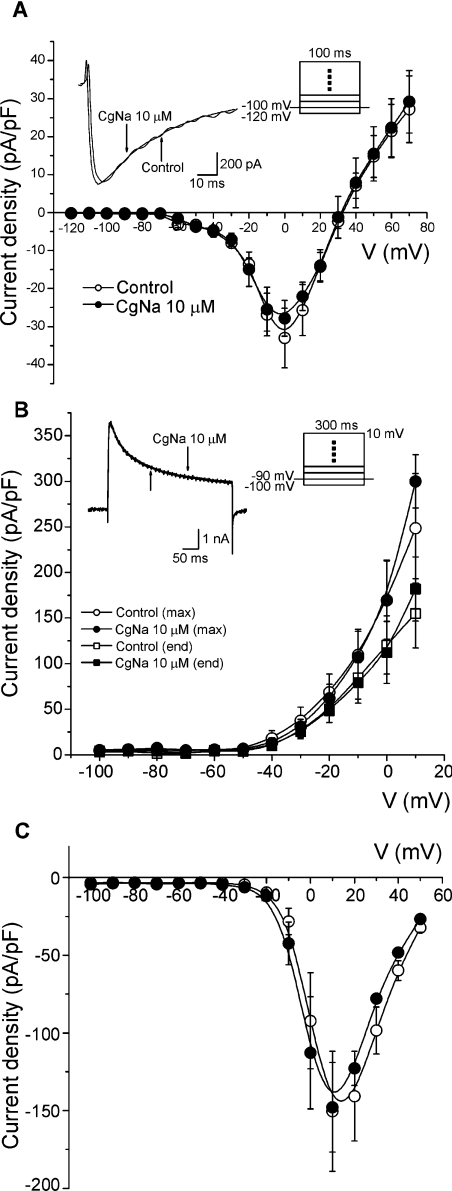
Figure 7. CgNa did not alter TTX-R sodium, potassium or calcium currents.
In all panels, two superimposed traces and two current-density–voltage curves are presented, one under control conditions (open circles) and the other approx. 2 min after toxin perfusion (closed circles). (A) TTX-R sodium currents were isolated in the presence of 300 nM TTX. (B) Current-density–voltage curves for the potassium channels were obtained measuring the maximum current (circles) or the current at the end of the trace (squares) and normalizing these data to membrane capacity. (C) Current-density–voltage curves as obtained for calcium channels.

