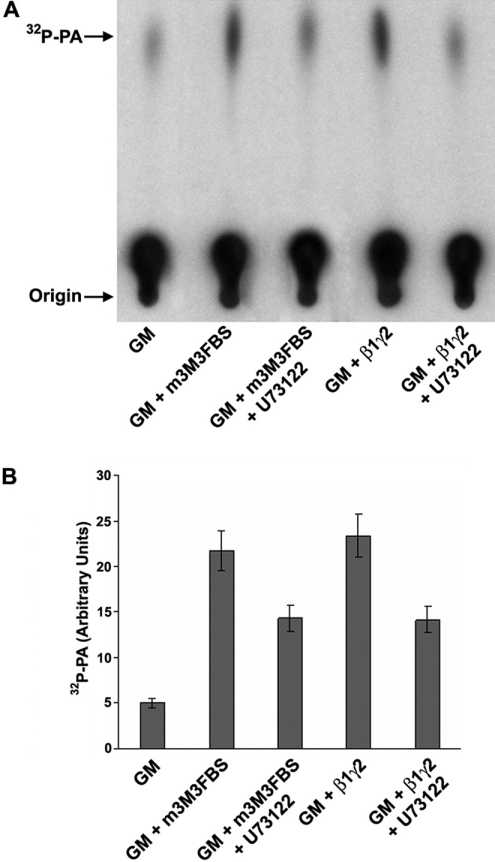
Figure 4. β1γ2 and m-3M3FBS induce DAG production at similar levels.
(A) Purified rat Golgi membranes (GM) were incubated with purified His–β1γ2 or m-3M3FBS in the presence or absence of U73122. Then, the membrane lipids were extracted and subjected to a DGK assay, as described in the Experimental section, and finally they were analysed by TLC for DAG production, which was measured as quantity of [32P]PA. (B) Densitometry of the experiment described in (A). Values are means (±S.D., vertical bars) for five separate experiments.

