Figure 1.
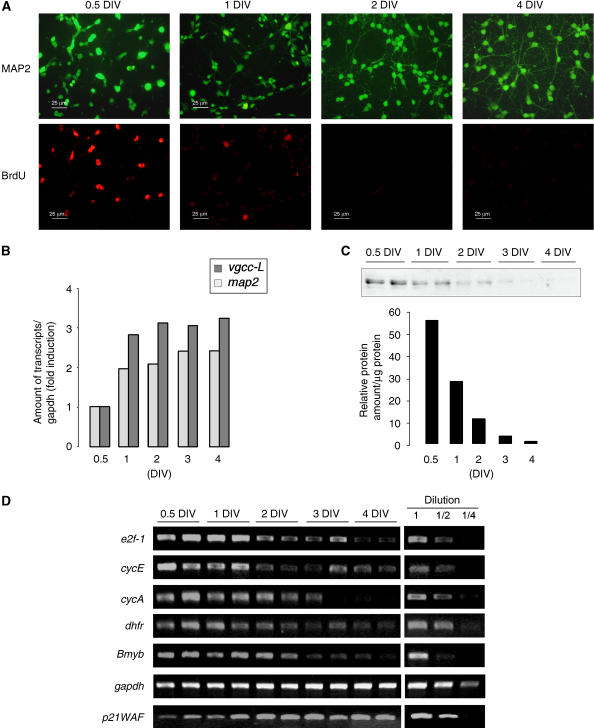
Synchronous silencing of e2f-targeted genes during NTD. (A) CGN morphology in primary cultures was visualized at different DIV by a MAP2 immunostaining (upper panel). Mitotic activity was evidenced by BrdU incorporation followed by immunodetection (lower panel). (B) Expression of the neuronal markers MAP2 and the L-type voltage-gated calcium channel (vgcc-L) was measured by semiquantitative RT–PCR. Bands were quantified relative to gapdh amounts and results are represented as fold induction. (C) E2F1 protein levels were measured by western blot analyses at different DIV. A typical experiment is shown and quantified (D) Expression of several e2f-targeted genes: e2f1, cyclin E, cyclin A, dhfr, Bmyb was analyzed by semiquantitative RT–PCR. A series of dilutions (1/2 and 1/4) was performed to ensure the linear range of amplification. Experiments have been repeated 3–5 times.

