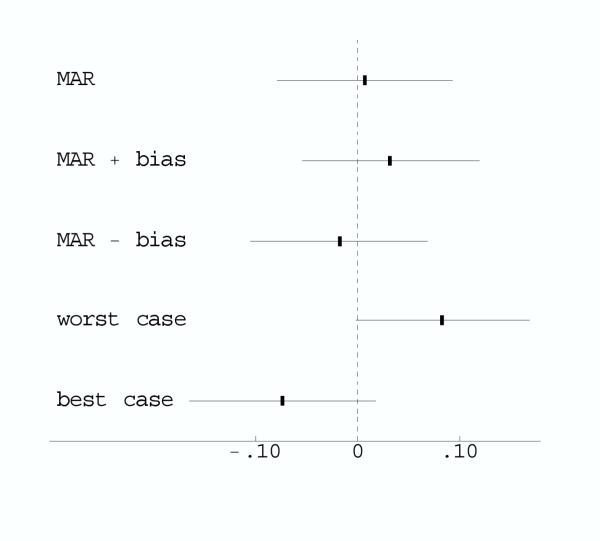
Figure 2.
Comparison of missing data adjustments for Polyp Prevention Trial. The graph plots the estimated differences in the probability of adenoma recurrence between the intevention and control groups and the 95% confidence intervals. MAR is missing at random within strata. MAR ± bias shifts the MAR confidence interval based on the anticipated maximum bias. Worst and best case imputes missing data to the randomization group that would give the largest positive and negative effect, respectively.

