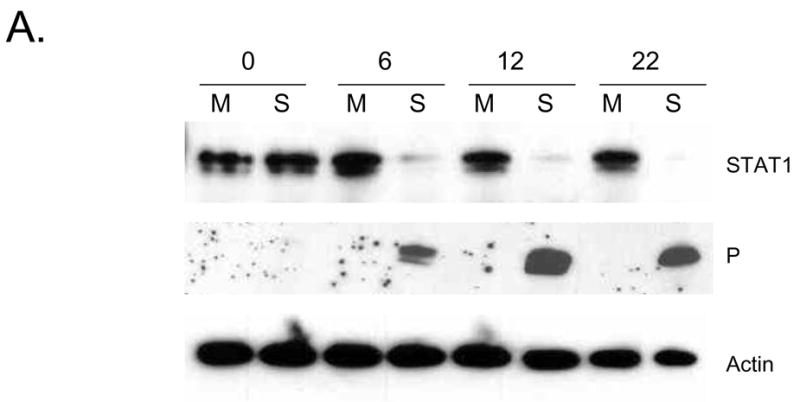
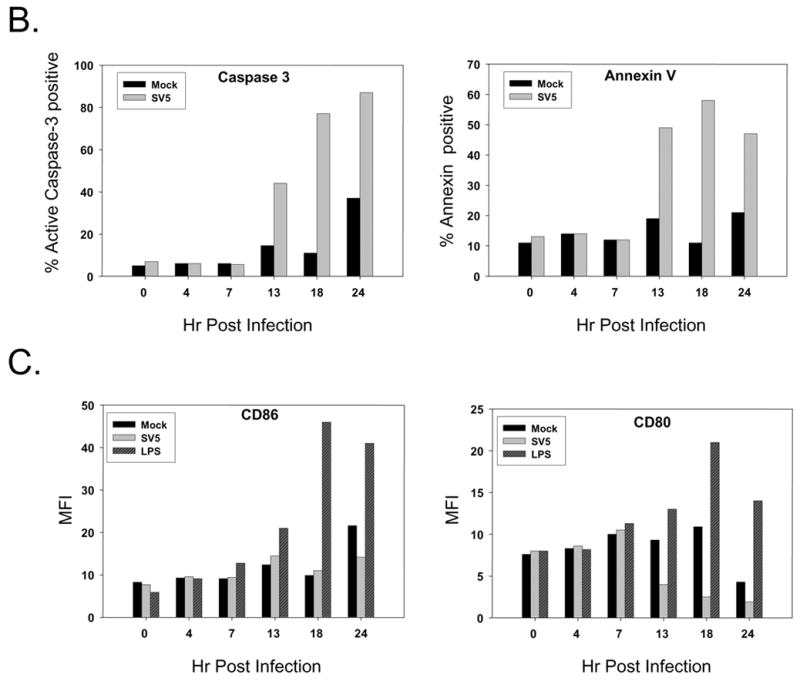
Figure 3. Timecourse of STAT1 degradation, viral protein expression, apoptotic markers and maturation markers during SV5 infection of immature moDC.


A) Immature moDC from a representative donor were mock infected (M lanes) or infected at an moi of 5 with WT rSV5 (S lanes). Cell lysates were prepared at the indicated times pi, and analyzed by western blotting for STAT1, P protein and actin. B and C) Timecourse of appearance of apoptotic markers and maturation markers. Immature DC from a representative donor were mock infected or infected at an moi of 5 with WT rSV5. At the indicated times pi, cells were analyzed by flow cytometry for intracellular levels of active caspase-3 and cell surface annexinV (panel B), or for cell surface CD86 and CD80 (panel C). In panel C, a sample of mock infected immature moDC were treated at time 0 with LPS to serve as a positive control for the timecourse of appearance of DC maturation markers.
