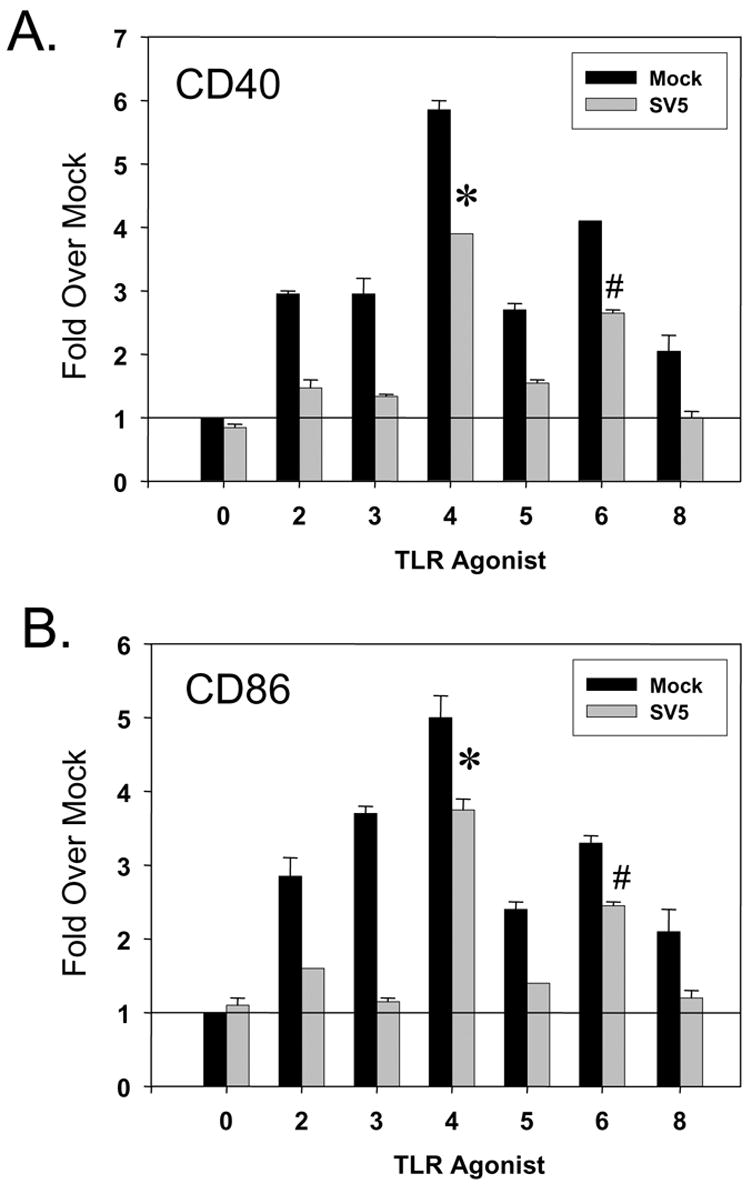
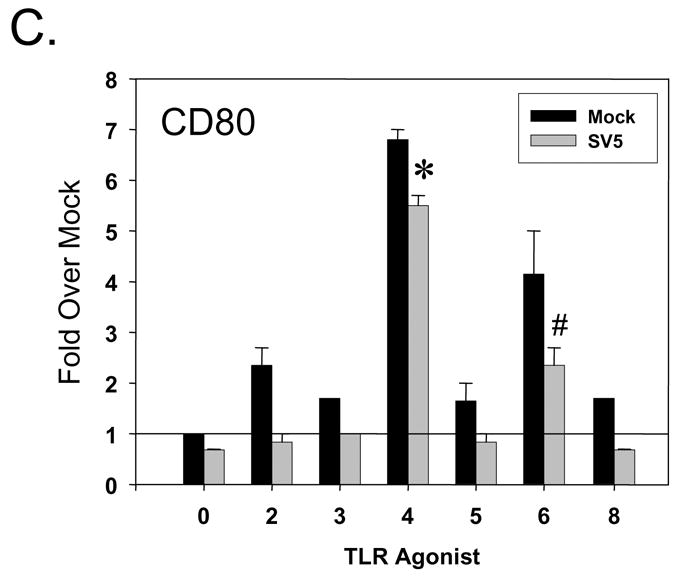
Figure 4. TLR-4 and -6 agonists induced cell surface maturation markers on SV5-infected immature moDC.


Immature moDC were mock infected or infected at an moi of 5 with WT rSV5. At 7 h pi, cells were mock treated or treated with the indicated TLR agonists as detailed in Materials and Methods. Levels of cell surface CD40 (panel A), CD86 (panel B) and CD80 (panel C) were determined by flow cytometry. Mean fluorescent intensities from three experiments using three individual donors (with standard error bars) are expressed as a fold change relative to mock infected, mock treated sample set at 1 (indicated by horizontal line). *, P values for CD40, CD86 and CD80 on TLR-4 agonist treated SV5 infected cells compared to untreated infected control cells were 0.0003, 0.002 and 0.005, respectively. #, P values for CD40, CD86 and CD80 on TLR-6 agonist treated infected cells compared to untreated SV5 infected control cells were 0.002, 0.04, and 0.007, respectively.
