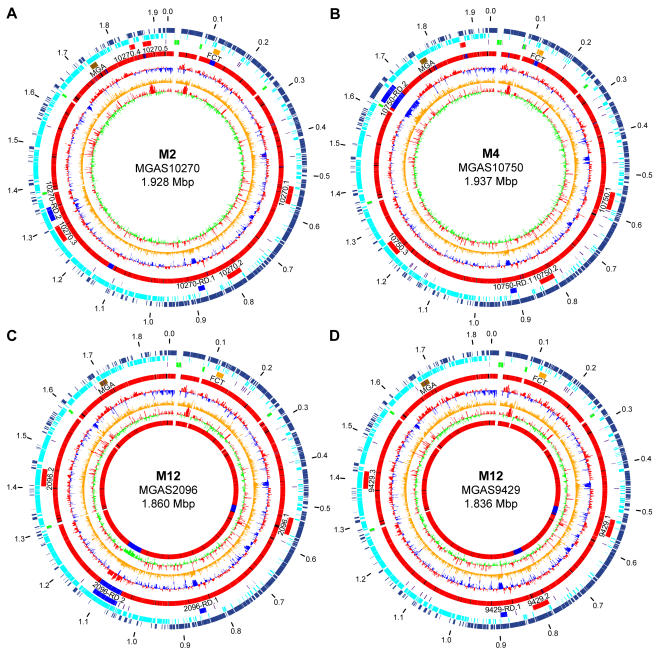
Figure 1. Genome circular atlases.
(A) MGAS10270, (B) MGAS10750, (C) MGAS2096, and (D) MGAS9429. Data from outermost to innermost circles are in the following order. Genome size in mega base pairs (circle 1). Annotated coding sequences on the forward (circle 2) and reverse strands (circle 3) are in dark and light blue, respectively. Reference landmarks (circle 4) illustrated are: ribosomal RNAs in green, FCT region in gold, transposons in purple, prophages in red, ICEs in royal blue, and Mga regulon region in brown. Comparison of gene content to the 11 other sequenced GAS strains (circle 5) is given as a gradient of nucleotide sequence similarity from low in blue to high in red. CDS percent G+C content (circle 6) with greater than and less than average in red and blue, respectively. Net divergence of CDS dinucleotide composition (circle 7) from the average is in orange. Codon adaptation index, that is codon use consistent with that of highly expressed genes (circle 8) with greater than and less than average in red and green, respectively. Additionally for the two serotype M12 strains a comparison of gene content relative to each other (circle 9) is given as a gradient of nucleotide sequence similarity from low in blue to high in red.

