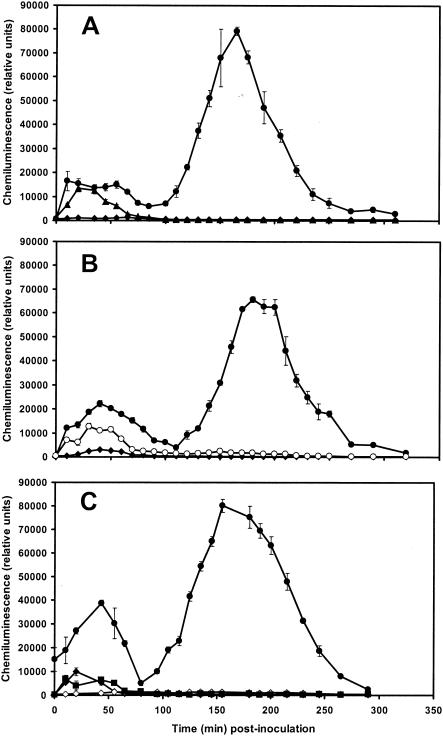
FIG. 4.
Kinetics of H2O2 production induced in flax cell suspensions. H2O2 production was measured by using chemiluminescence of luminol and was monitored at 10-min intervals for 5 h. (A) Inoculation with 106 microconidia or 106 nongerminated microconidia g FWC−1 from the nonpathogenic F. oxysporum strain Fo47. Symbols: •, cells inoculated with germinated microconidia; ▴, cells inoculated with microconidia; ♦, control cells. The results are from one repetition in three independent experiments. The data are the means ± the SD of triplicate assays. (B) Inoculation with 106 germinated microconidia g FWC−1 from either the nonpathogenic strain Fo47 or the pathogenic strain Foln3 of F. oxysporum. Symbols: •, cells inoculated with germinated microconidia of Fo47; ○, cells inoculated with germinated microconidia of Foln3; ♦, control cells. The results are from one repetition in six independent experiments. Data are the means ± the SD of triplicate assays. (C) Inoculation with 106 germinated microconidia g FWC−1 from the nonpathogenic strain Fo47 with or without DPI (15 μm) added 10 min before inoculation. Symbols: •, cells inoculated with germinated microconidia; ▪, cells inoculated with microconidia and treated with DPI; ♦, control cells; ⋄, control cells treated with DPI. The results are from one repetition in three independent experiments. The data are the means ± the SD of triplicate assays.

