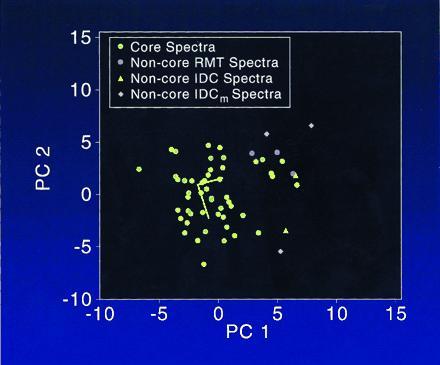
Figure 3.

The core cluster of points and “outlier” non-core points of the RMT, IDC, and IDCm groups represented by two principal components. Note that all the non-core points are located on the right side of the plot. Moreover, each non-core point, with the exception of the two points in the lower portion of the plot (location, ≈−5, 5), are spatially close to the IDC → IDCm progression trend. The non-core points may well represent DNAs having a relatively high degree of structural damage.
