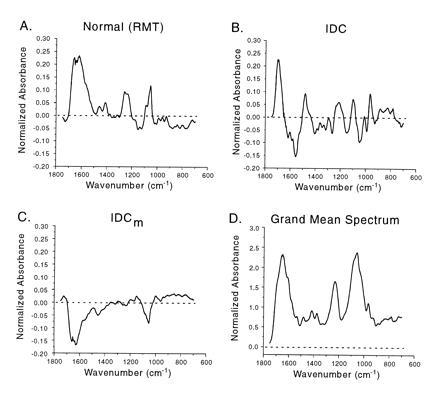
Figure 4.

The mean spectrum of each core cluster (A–C) minus the grand mean (D) of all core spectra. Substantial differences in the spectra of the RMT, IDC, and IDCm groups are obvious and particularly notable in the regions assigned to vibrations of the nucleotide bases (≈1750-1400 cm−1), the PO2 structure (e.g., ≈1240 cm−1), and deoxyribose (≈1100-900 cm−1). Dramatic differences in the spectra between the IDC and the IDCm are especially notable (see text for details).
