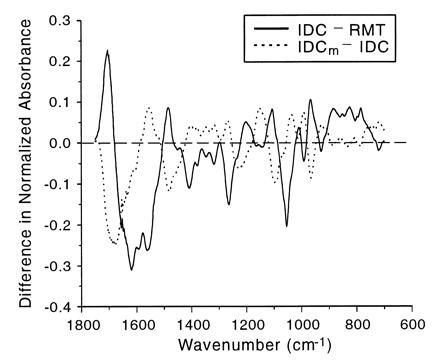
Figure 5.

Plot depicting differences in the mean spectra of the IDC and RMT groups versus differences in the mean spectra of the IDC and IDCm groups. The solid line represents the mean IDC spectrum minus the mean RMT spectrum, and the dotted line represents the mean IDCm spectrum minus the mean IDC spectrum. Major absorbance–wavenumber differences are evident over virtually the entire spectral region, demonstrating that the progression from normal tissue to primary tumor tissue involves a markedly different suite of DNA modifications than the progression to the metastatic state.
