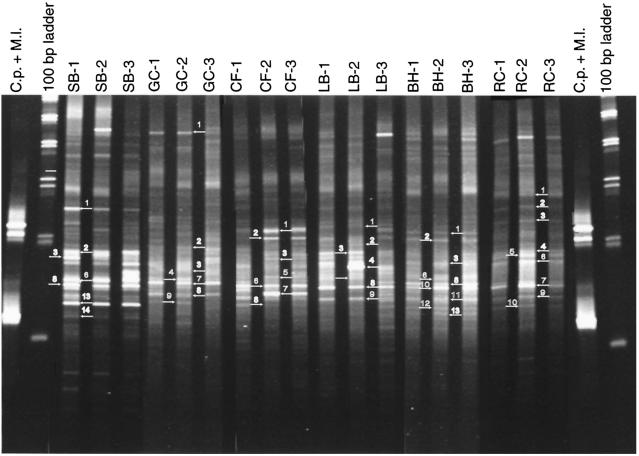
FIG. 3.
DGGE profiles of microbial communities inhabiting each river site. PCR products were synthesized with the universal primer pair 536fC-907r. Labels above each lane indicate which site the pattern represents. Three samples were analyzed from each site. Clostridium perfringens (C.p.) and Micrococcus luteus (M.l.) were used as reference patterns during the normalization procedure in GelCompar. Numbers and arrows indicate which bands were cut and sequenced for the phylogenetic analysis.

