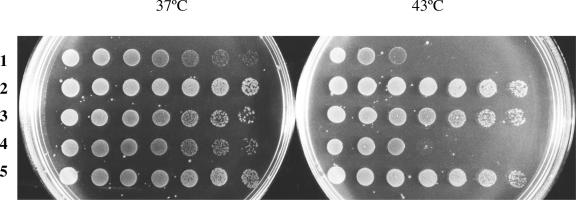
Fig 4.
Complementation analysis of cpn60.1, cpn60.2, and cpn60.3 in Escherichia coli. Spots are of 10-fold dilutions of log phase cultures of SF103. Plates were incubated at 37°C or 43°C. All plates contained 0.1 mM IPTG. Strains contain the following plasmids: (1) pSU18 (negative control); (2) pSUBH (expresses E. coli GroES and GroEL); (3) pHB4 (expresses Cpn10.1 and Cpn60.1), (4) pHB5 (expresses Cpn10.2 and Cpn60.2), (5) pHB6 (expresses Cpn10.3 and Cpn60.3)

