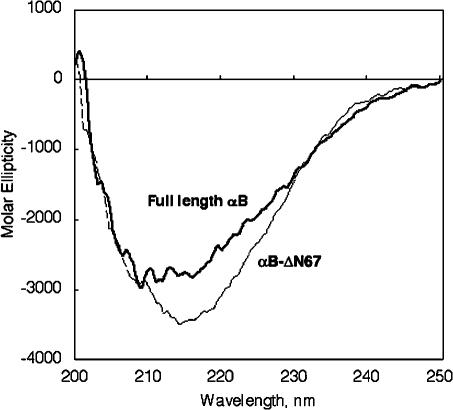
Fig 2.
Analysis of secondary structure of the N-terminal domain deletion mutant (αB-ΔN67) by far-ultraviolet circular dichroism. The circular dichroism spectra shown here represent the average of 8 scans, smoothed by polynomial curve fitting. The circular dichroism data are expressed as molar ellipticity (degrees cm2/dmol)

