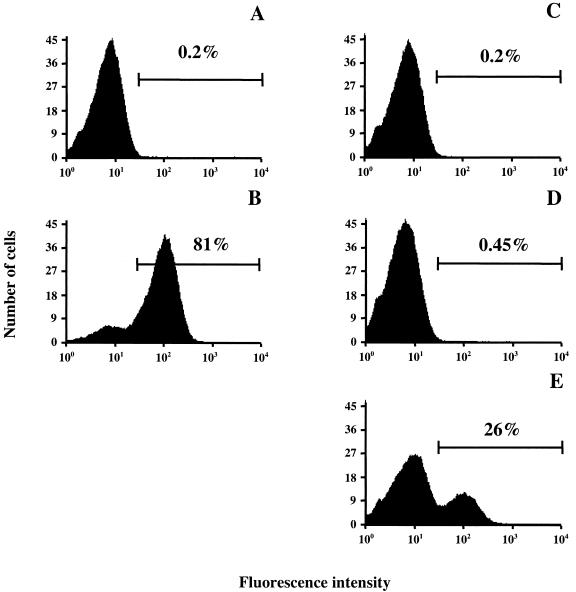
FIG. 4.
Histograms of results from cell-sorting experiments. Wild-type and recombinant S. carnosus cells were probed with biotinylated IgG and stained with an Alexa-Fluor488-streptavidin conjugate. The bar in each graph represents the sorting gate setting, i.e., the minimum fluorescence intensity defined as a positive event. (A) Sc:ZRSV1 sample used as a negative control; (B) Sc:Zwt sample used as a positive control; (C) a 1:100,000 mixture of Sc:Zwt to Sc:ZRSV1 cells analyzed prior to the first cell-sorting round; (D) a 1:100,000 mixture of Sc:Zwt to Sc:ZRSV1 cells recovered from the first cell-sorting round; (E) a 1:100,000 mixture of Sc:Zwt to Sc:ZRSV1 cells recovered from the second cell-sorting round. The histograms show results for nonstained Sc:ZRSV1 bacterial cells to the left and results for cells exposing Zwt-containing proteins on their surfaces shifted to the right. Fluorescence intensity is shown on the x axis, and the number of cells is shown on the y axis.

