
Figure 3.
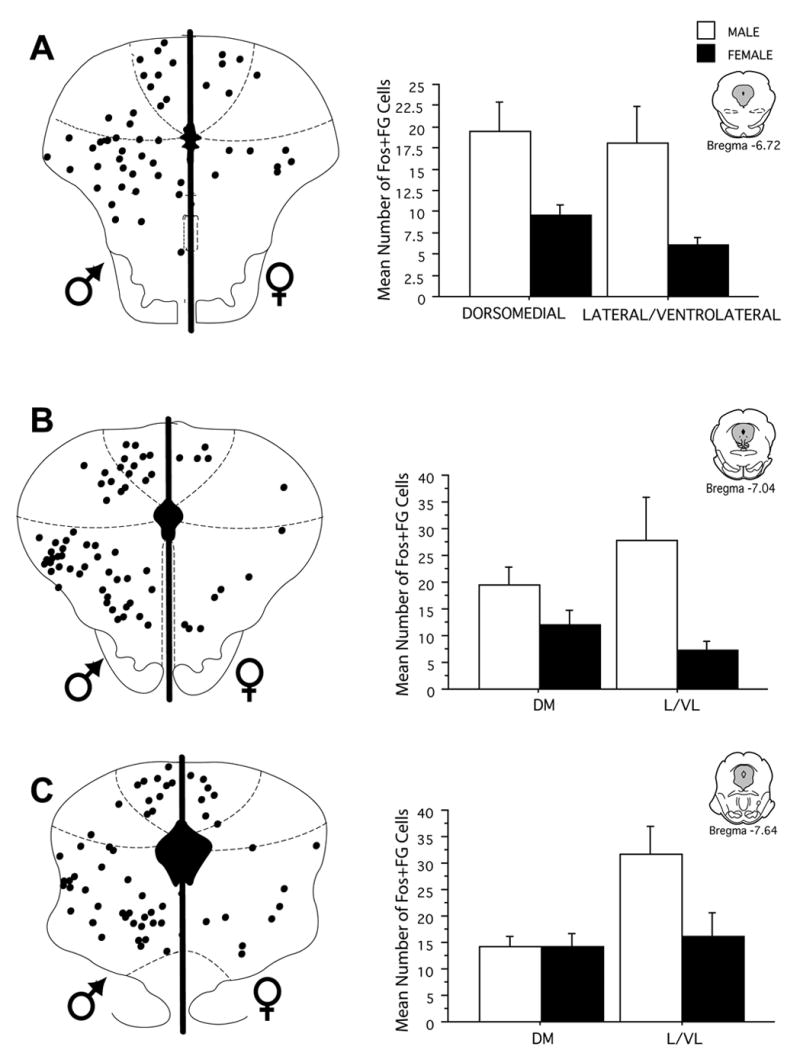
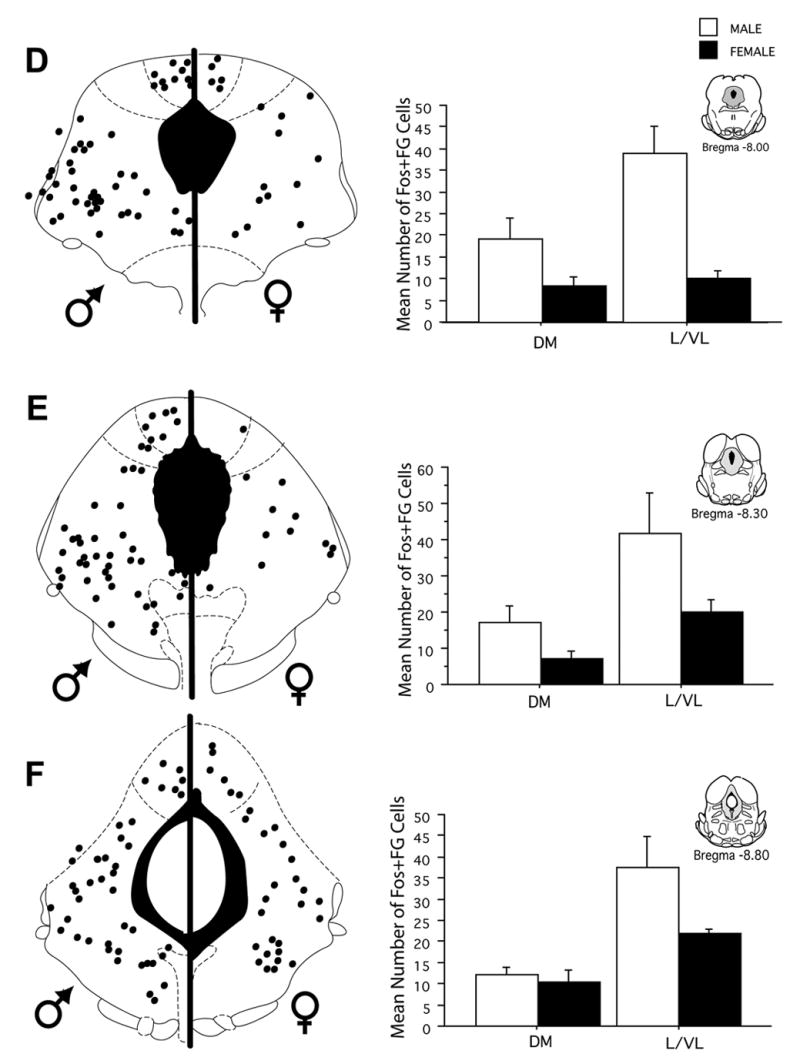
Distribution of PAG-RVM output neurons that expressed morphine-induced Fos in male and female rats across six rostrocaudal levels of the PAG. Each black circle represents one double-labeled (Fos+FG) cell. Bar graphs display the mean number of Fos+FG cells (± S.E.M.) for each level of the dorsomedial and lateral/ventrolateral regions of the PAG. Fos labeling was greater in male than female rats in all PAG regions measured.