
Figure 4.
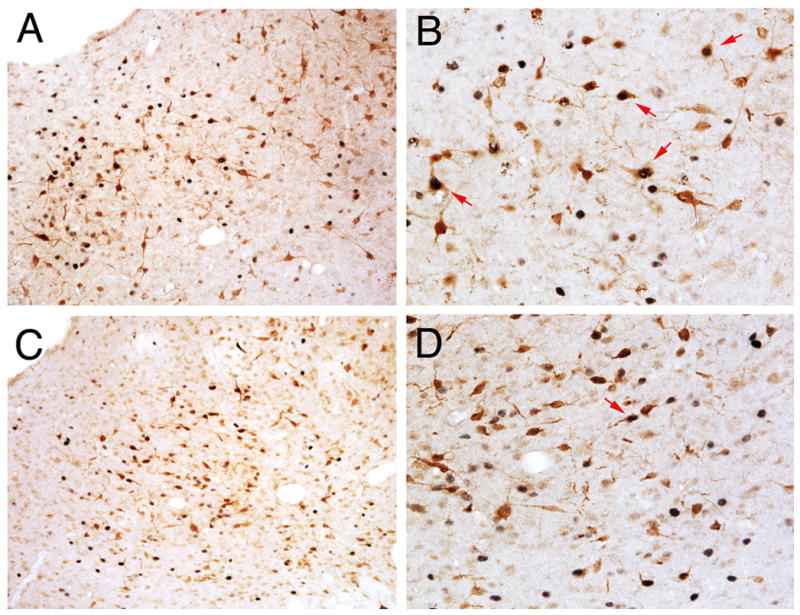
Photomicrograph showing morphine-induced Fos in FG+ cells for males (A, 10X; B, 20X) and females (C, 10X; D, 20X). Note that while females have a greater number of FG+ cells than males, very few of these cells expressed morphine-induced Fos (indicated with red arrows). No sex differences were noted in the total number of Fos+ cells.