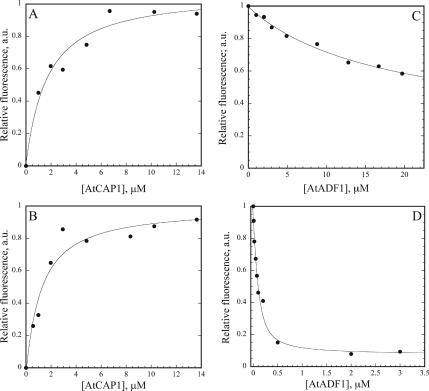
Figure 3.
AtCAP1 binds to both ATP– and ADP–G-actin. (A) The increase in fluorescence of 0.2 μM Mg–ATP–G-actin (50% NBD labeled) was plotted as a function of [AtCAP1]. Dissociation equilibrium constants were determined by fitting the data as described in Materials and Methods. A single representative experiment which gave a Kd of 1.6 μM is shown. (B) The affinity of AtCAP1 for ADP–G-actin was determined as outlined above. A single representative experiment, which gave a Kd of 1.1 μM, is shown. (C) The affinity of AtADF1 for ATP–G-actin was followed by quenching of fluorescence. A single representative experiment, which gave a Kd of 17 μM, is shown. (D) The affinity of AtADF1 for ADP–G-actin, from a single representative experiment, gave a Kd of 0.05 μM.

