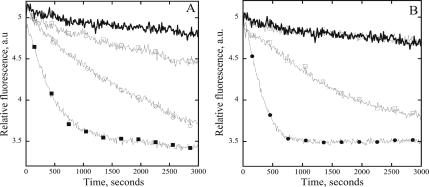
Figure 8.
AtCAP1 enhances the rate of actin filament turnover in the presence of ADF/cofilin. Shown is the exchange of fluorescent ε-ADP–actin in filaments for unlabeled ADP–actin, in the presence of various actin binding proteins, as a function of time. (A) Plotted are reactions containing 4 μM actin alone, thick black line; 4 μM actin and 1 μM AtCAP1, open squares; 4 μM actin and 3 μM AtADF1, open circles; and 4 μM actin and 3 μM AtADF1 and 1 μM AtCAP1, closed squares. (B) Plotted are 4 μM actin alone, thick black line; 4 μM actin and 4 μM AtPRF4, open circles; 4 μM actin with 3 μM AtADF1 and 4 μM AtPRF4, open squares; and 4 μM actin with 3 μM AtADF1 and 1 μM AtCAP1 and 4 μM AtPRF4, closed circles. The plots in A and B are from representative experiments performed on the same day. Turnover rates were estimated by fitting the data with a monoexponential function. Mean rates ± SD obtained from four to six experiments were as follows: actin alone = 0.00005 ± 0.00005 a.u./s, actin + ADF = 0.0007 ± 0.0003 a.u./s, actin + AtCAP = 0.00015 ± 0.0001 a.u./s, actin + PRF4 = 0.0009 ± 0.0009 a.u./s, actin + ADF + PRF4 = 0.0009 ± 0.0006 a.u./s, actin + ADF + AtCAP = 0.0017 ± 0.0011 a.u./s, and actin + ADF + CAP + PRF4 = 0.0021 ± 0.0015 a.u./s.

