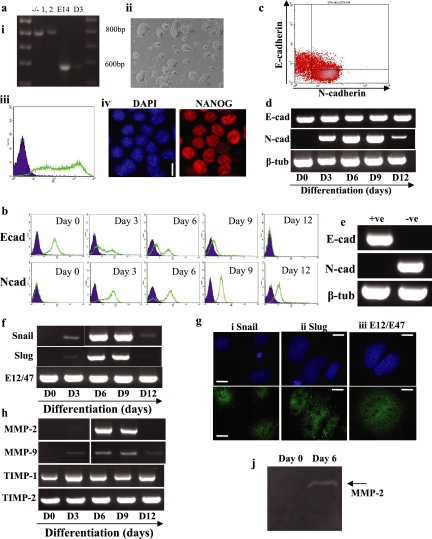
Figure 7.
5T4 null ES cells exhibit EMT-associated events after differentiation. 5T4 null ES cells were isolated as described in Materials and Methods. (a) (i) Genotyping of 5T4 null ES cells (clones 1 and 2) compared with wild-type E14 and D3 ES cells was assessed by PCR. Wild-type ES cells exhibited a 600-bp product, whereas 5T4−/− ES cells exhibited an 800-bp product. (ii) Phase-contrast microscopy image of undifferentiated 5T4−/− ES cells cultured in ES cell medium (FCS+LIF). (iii) SSEA-1 expression was determined in undifferentiated 5T4−/− ES cells by fluorescent flow cytometry analysis. (iv) Expression of NANOG protein in undifferentiated 5T4−/− ES cells was assessed using fluorescent microscopy. Bar, 5 μm. (b) Cell surface E-cadherin (E-cad) and N-cadherin (N-cad) proteins were assessed in undifferentiated 5T4−/− ES cells (day 0) and differentiated cells for 3, 6, 9, and 12 d by fluorescent flow cytometry in a Becton-Dickinson FACScaliber. E- or N-cadherin, open population; isotype control antibodies, closed population. (c) Fluorescent flow cytometry dual staining for E- and N-cadherin on 5T4−/− ES cells differentiated for 3 d as described above. (d) RT-PCR analysis of E- (E-cad) and N-cadherin (N-cad) and β-tubulin (β-tub; control) transcript expression was assessed in undifferentiated 5T4−/− ES cells (day 0) and in cells differentiated for 3, 6, 9, and 12 d as described above. (e) 5T4−/− ES cells were differentiated for 3 d as described above, and E-cadherin–positive (+ve) and E-cadherin–negative (−ve) cells were isolated by FACS. RT-PCR was performed on the samples to assess E- (E-cad) and N-cadherin (N-cad) and β-tubulin (β-tub) transcript expression. (f) Transcript expression of Snail, Slug, and E12/E47 was determined by RT-PCR in undifferentiated 5T4−/− ES cells (day 0) and in cells differentiated for 3, 6, 9, and 12 d. (g) 5T4−/− ES cells were differentiated for 6 d and assessed for Snail (i), Slug and (ii), E12/E47 (iii) proteins using immunofluorescent microscopy. DAPI shows the total cells within the field of view. Bar, 5 μm. (h) Transcript expression of matrixmetalloproteinase (MMP)-2 and -9 and tissue inhibitor of metalloproteinase (TIMP)-1 and -2 was determined by RT-PCR in undifferentiated and differentiating 5T4−/− ES cells as described above. (j) Gelatin zymogram analysis was performed to determine MMP-2 and -9 activity within the culture supernatants of undifferentiated (day 0) and 5T4−/− ES cells differentiated for 6 d (day 6). Arrow shows the size of active MMP-2 (65 kDa). Note that MMP-9 was not detected under these conditions.

