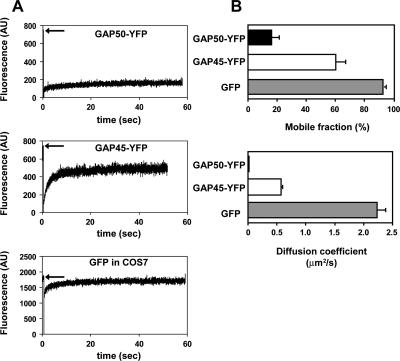
Figure 2.
Quantitative analysis of GAP50-YFP mobility in the inner membrane complex. (A) Fluorescence intensity was measured as a function of time after photobleaching for GAP50-YFP and two controls: GAP45-YFP, which localizes to the IMC but does not associate with glideosome, and COS7 cells expressing GFP. Arrows indicate level of fluorescence before bleaching. (B) Mobile fractions and diffusion coefficients were averaged for all three samples confirming the slow recovery of GAP50-YFP. For GAP50-YFP, n = 9; GAP45-YFP, n = 6; and COS7 with GFP, n = 3. AU, arbitrary unit.

