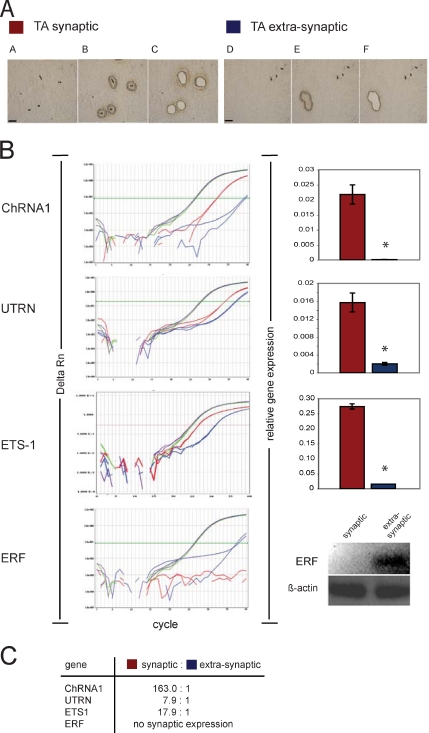
Figure 5.
ERF expression is restricted exclusively to extrasynaptic regions in muscle, suggesting a role in utrophin repression. (A) Microdissection steps of synaptic and extrasynaptic regions of rat TA muscle. Cryosections of 10 μm (TA) are stained with Karnowsky and Root's method to show NMJ localization by using PEN membrane glass slides, and they are visualized using PALM light microscopy at 20× power. (A and D) Visualization of TA tissue before LCM. (B and E) Same slide cut by laser for synaptic and nonsynaptic tissue parts intending to capture. (C and F) Section visualized post-LCM, showing removal of synaptic and nonsynaptic material by catapulting to the extraction buffer. Bars, 100 μm. (B) Taqman qRT-PCR amplification plots of Chrna1 (muscle), Utrn, Ets1, Erf, and β-actin are shown on the left side of Figure 5B. The x-axis shows PCR cycle numbers up to 40, and the y-axis illustrates the Δ of normalized reporter fluorescence dye (ΔRn), which refers to new product formation in each cycle. Color codes used refer to β-actin in TA-synaptic (purple) and TA-nonsynaptic (green) and the gene of interest in TA-synaptic (red) and TA-nonsynaptic (blue) in PCR analysis. Relative gene expression of analysis data results for duplicate wells of each gene are shown as bar graphs with standard deviations, with a star indicating statistically significant differences. Because ERF (blue lines) did not reach threshold levels in this analysis, its expression level is illustrated as an electrophoretic agarose (1%) gel product at the end of 40 cycles. (C) Summary of the relative expression synaptic:nonsynaptic ratio for all genes is illustrated.

