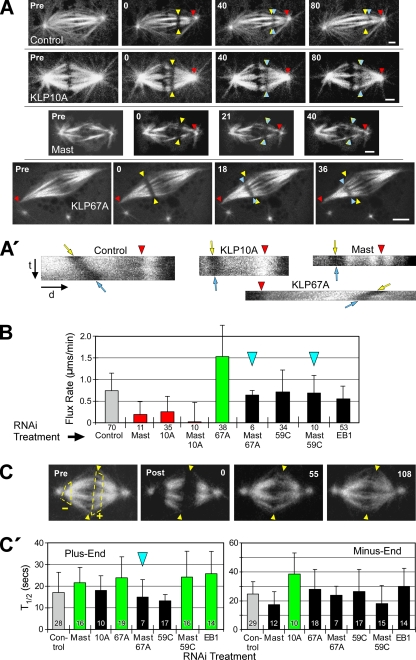
Figure 1.
Mast and multiple microtubule-destabilizing kinesins regulate the rate of poleward flux. (A) After RNAi of the indicated target proteins, flux rates were measured by photobleaching rectangular bars across fluorescent spindle microtubules and tracking their poleward motions. Yellow arrowheads mark the initial positions, blue arrowheads mark the current positions of the photobleached bars and red arrowheads mark the reference positions. Pre, prebleach spindle. Numbers are time (seconds) elapsed after the initial photobleached image. Scale bars, 2 μm. (A′) Kymographs generated from kinetochore fibers spanning the bleached regions of the spindles shown in A. Red arrowheads mark the same features as those in A; t and d indicate the time and distance axes, respectively. The angles of the bleached marks' tracks (between yellow and blue arrows) reflect the flux rates: the rate decreases as the track becomes vertical. These kymographs are illustrative only; flux rates were measured directly from movie frames like those in A. (B) Poleward flux rates after RNAi of targeted proteins. Statistically significant differences (p < 0.05) are indicated by green (greater than control), red (less than control), or black bars (not different from control). This scheme is used for all figures. Blue arrowheads mark co-RNAi treatments that are mentioned in the text as phenotype rescues. Error bars, +SD. Numbers below bars, N. (C) FRAP of microtubule ends was used to measure α-tubulin subunit turnover after RNAi. Pre, spindle before photobleaching. Arrowheads mark the spindle equator; dashed lines outline regions at plus (+) and minus ends (−) to be photobleached. Post, spindle immediately after photobleaching; numbers are elapsed time (seconds) after the first postbleach image. (C′) FRAP half-times (T1/2) of microtubule plus (left) and minus ends (right) after RNAi treatment. Error bars, +SD. Numbers within bars, N.

