Figure 2.
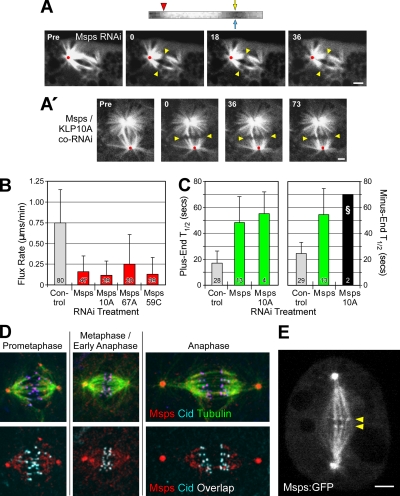
Msps is required for poleward flux. (A) A photobleached mark on a spindle after Msps RNAi is stationary, indicating an absence of flux. Yellow arrowheads mark the initial photobleach position; red dots mark the spindle reference point. Scale bars, 2 μm. The kymograph (top) was generated from a kinetochore fiber spanning the bleached region; the markings are the same as in Figure 1A′. The vertical track of the photobleached region is a result of flux cessation. (A′) CoRNAi of Msps and KLP10A does not restore flux. (B) Average flux rates after RNAi of the indicated target proteins. (C) Average fluorescence recovery half-times (T1/2) after photobleaching. The Msps/KLP10A co-RNAi treatment (§) was not be statistically analyzed because too few measurements (N = 2; SD = 0) were obtained. (D) Immunolocalization of Msps and Cid (a kinetochore marker) in mitotic eGFP-α-tubulin–expressing S2 cells. Images are maximum intensity projections. In the bottom panels, Msps and Cid colocalization is indicated by areas of white overlap. (E) A single confocal z-section from a live, stably transfected S2 cell expressing Msps-eGFP. The small but clearly visible puncta aligned at the spindle equator (yellow arrowheads) presumably mark the positions of kinetochores. This image was obtained from a frame of Supplementary Movie 5. Scale bar, 2 μm.

