Figure 2.
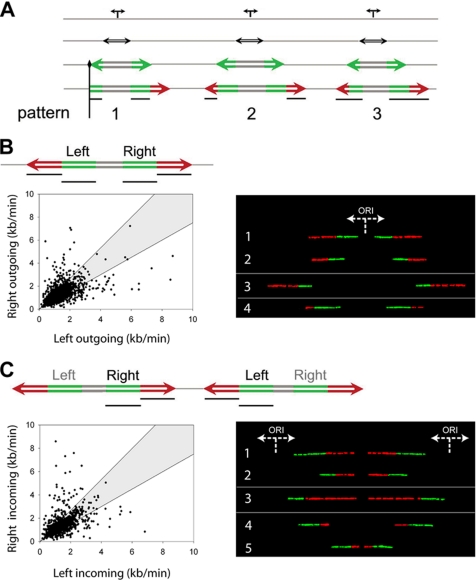
Correlated changes in fork velocities. (A) Schematic representation of asymmetric replication bubbles resulting either from blocked forks (type 1 signal) or from changes in fork velocity (type 2 and 3 signals). Vertical black line, a permanent replication fork barrier; horizontal black lines, the segments that were measured and compared in order to examine fork speed correlations. (B) Coregulation of forks moving from a single origin (outgoing forks). Left, a scheme of the signals used in the analysis is represented at the top, with black lines indicating the segments that were measured and plotted against each other. In the scatter diagram, each dot corresponds to the ratio between the right and the left fork velocities of a pair of outgoing forks belonging to the same replication bubble. The shaded area includes all points whose ratios deviate from the expected theoretical value of 1 for <33%. The significant positive correlation of the outgoing forks (R = 0.53; p < 0.001; N = 1518) and the value of their linear regression coefficient (b = 0.87) indicate that they move bidirectionally at nearly the same rate. Right, examples of correlations between corresponding outgoing forks on individual DNA molecules. Generally, forks tend to maintain a constant speed between the first (green) and the second (red) pulse (see molecules 1 and 2). However, when this condition is not satisfied (see molecules 3 and 4), the symmetry between corresponding outgoing forks is still maintained, indicating a simultaneous change of their velocities. (C) Coregulation of forks moving from adjacent origins (incoming forks). Left, as in B, a scheme of the signals used for the analysis is shown at the top of the diagram. The black lines indicate the pair of segments measured and plotted against each other and are represented in the scatter graph with the same delimiting envelope. The significant positive correlation of the incoming forks (R = 0.50; p < 0.001; N = 1172) and the value of their linear regression coefficient (b = 0.93) indicate that they move at nearly the same rate. Right, examples of correlations between corresponding incoming forks on individual DNA molecules. As in B, right panel, forks tend to keep a constant speed between the first and the second pulse (see molecules 1 and 2). However, when this condition is not fulfilled (see molecules 3–5), the symmetry between corresponding incoming forks is still maintained, indicating a simultaneous change of their velocities.

