Figure 2.
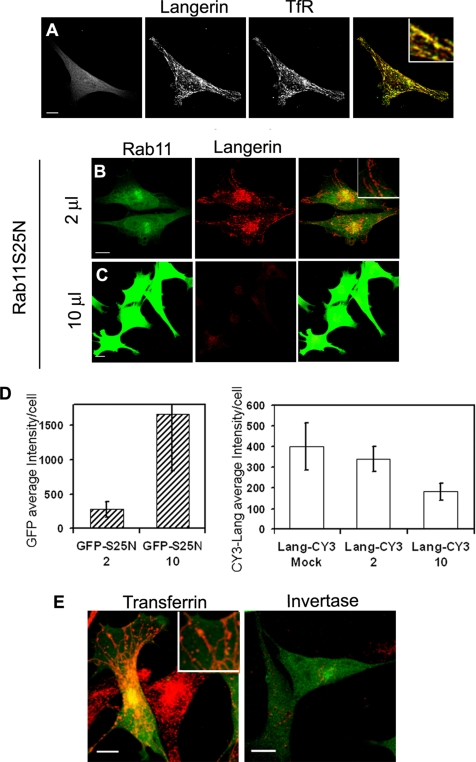
Effects of Rab11AS25N overexpression on Langerin levels and distribution and transferrin and invertase internalization in M10-22E cells. Cells infected with GFP–Rab11AS25N (A, left) were labeled with an antiserum against the cytoplasmic domain of Langerin revealed with anti-rabbit Cy3 (A, middle) and with an anti-TfR mAb revealed with anti-mouse Cy5 (A, right). The overlay image in A corresponds to the merging of Langerin and TfR staining and shows that the distributions of the two molecules are strongly correlated. Cells transduced with two different doses (2 μl of stock solution (B) or 10 μl (C)) of recombinant adenoviruses encoding the dominant-negative mutant GFP–Rab11AS25N were labeled with the anti-Langerin mAb DCGM4 (B and C) revealed with donkey anti-mouse Cy3. Bars, 10 μm. All images were acquired with an SP2 AOBS confocal microscope. The fluorescence intensities of GFP-Rab11AS25N and Langerin (D) were quantified as described in Materials and Methods by using stacks of images acquired with a wide-field microscope. Values are means ± SD of the average intensity per cell with n = 19, 29, and 23 cells for the mock, 2- and 10-μl experimental conditions, respectively. Cells infected with a low dose (2 μl) of GFP–Rab11AS25N were incubated with 10 μg of Cy3-transferrin (E, left) or Cy3-invertase (E, right) for 1 h at 37°C. Higher magnification insets are included to improve the visualization of structural details in the merged images (A, B, and E). Bars, 10 μm.

