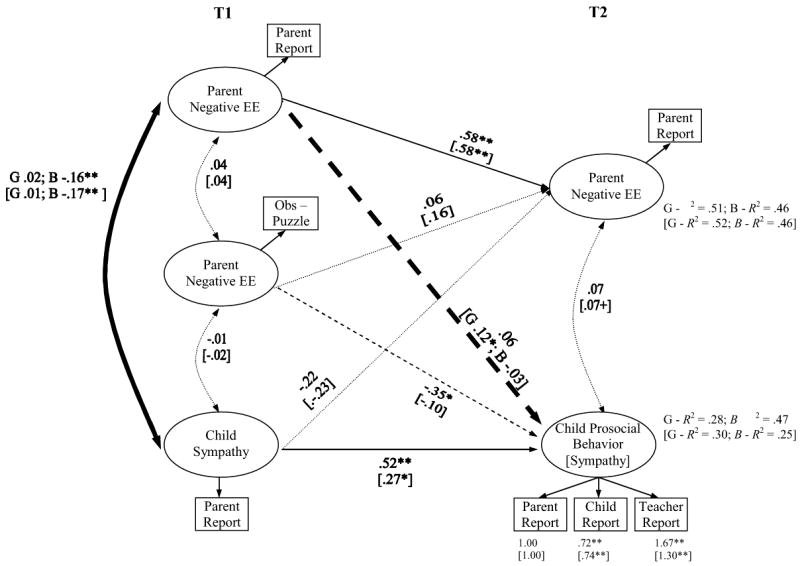
Figure 3.

Negative Model with T2 Adolescent Prosocial Behavior Testing Moderation by Sex [Alternative Negative Model with T2 Adolescent Sympathy below in brackets]. Bold lines represent moderated paths, solid lines represent significant paths, dotted lines represent nonsignificant paths, and dashed lines represent significant paths for either prosocial behavior or sympathy. Unstandardized coefficients are presented for all paths.
+p < .10, *p < .05, **p < .01. Model 3 with Adolescent Prosocial Behavior: χ2 = 31.61 (27, N = 210), p = .25, CFI = .96, RMSEA = .04 (90% CI = .00 to .09), SRMR = .09. Model 3 with Adolescent Sympathy: χ2 = 31.04 (24, N = 210), p = .15, CFI = .94, RMSEA = .05 (90% CI = .00 to .10), SRMR = .09.
