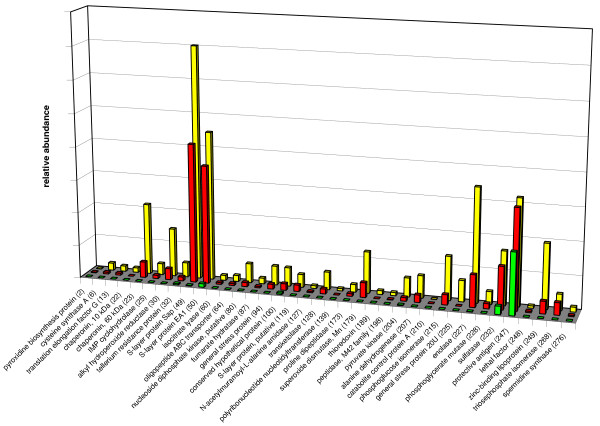
Figure 5.
Relative protein expression of differentially expressed extracellular proteins of B. anthracis strain RA3R (pXO1+/pXO2-) during exponential growth at 6 hr (green bars), 10 hr (red bars) and 16 hr (yellow bars), based on spot size and pixel intensity. The relative amount of each protein was determined using the 2D Phoretix software. The protein numbers refer to additional file 1.

