
Figure 1.
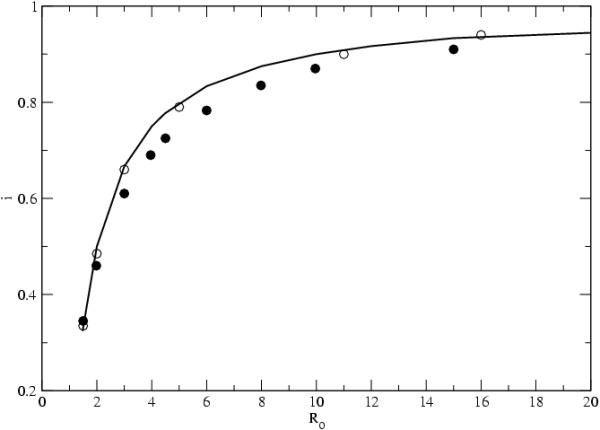
Infected Individuals. The proportion of infected individuals, i, with increasing R0 = NdmK/e. Full circles are the results for scale free networks (with γ = 3) and empty circles for the island model. D = 900, Nd = 10, e = 0.01 in all network topologies. The line denotes the expected value of i under the deterministic SIS model.